
Free Uptime Monitoring and Status Page Setup for Your Website [205 Current guide]
In a SaaS project, especially during the MVP phase when you're trying to win your first customers, one of the most crucial elements is building trust, creating a professional image, and demonstrating sustainability. So, does this mean you need to start paying for expensive tools right from the beginning, especially for a microSaaS? Absolutely not.
In this series, where we try to build everything for free, I want to show you how you can perfectly set up one of the most important tools—a Status Page and Uptime Monitoring—for free, and most importantly, without a demo or time limit (you can use it for as long as you want).
For years, I have been using RobotAlp for this solution. For me, what makes RobotAlp indispensable is its complete stability. With tools like these, being flawless is critical; false notifications can wear you out and shake your confidence. Furthermore, it's not just about Uptime; it also offers other monitoring tools. The free account provides incredible advantages: 3-minute check intervals, 14 different tools, and most importantly, the ability to have 20 monitors and 1 status page. And believe me—as my job requires me to review SaaS lists, I've checked them all—there is no other tool that offers this many features and advantages for free.
Now, let's get to the step-by-step setup. First, let's sign up here: https://robotalp.com/free-website-monitoring/, and then follow the steps below, one by one.
Part 1: Setting Up Your First Uptime Monitor
The first step is to create a monitor that will actively check your website. This monitor will be the engine that powers your status page later on.
Step 1: Create a New Monitor
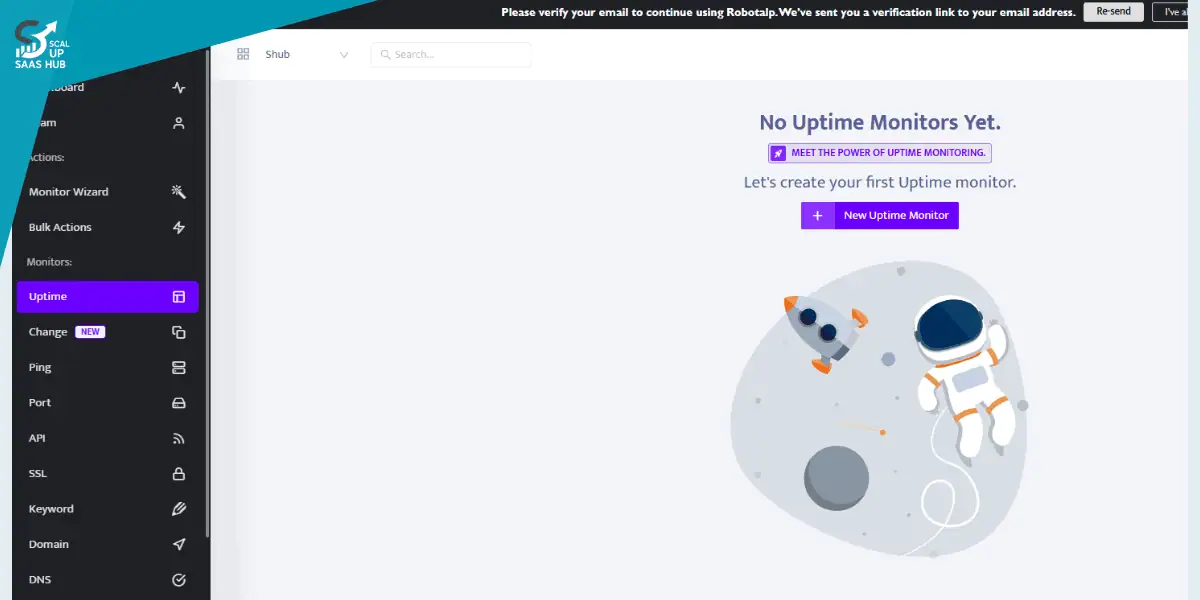
Once you've logged into your RobotAlp dashboard, navigate to the Monitors > Uptime section from the left-hand menu. Since this is your first time, you'll see a welcome screen. To begin, click on the "+ New Uptime Monitor" button.
Step 2: Fill in Your Website Details
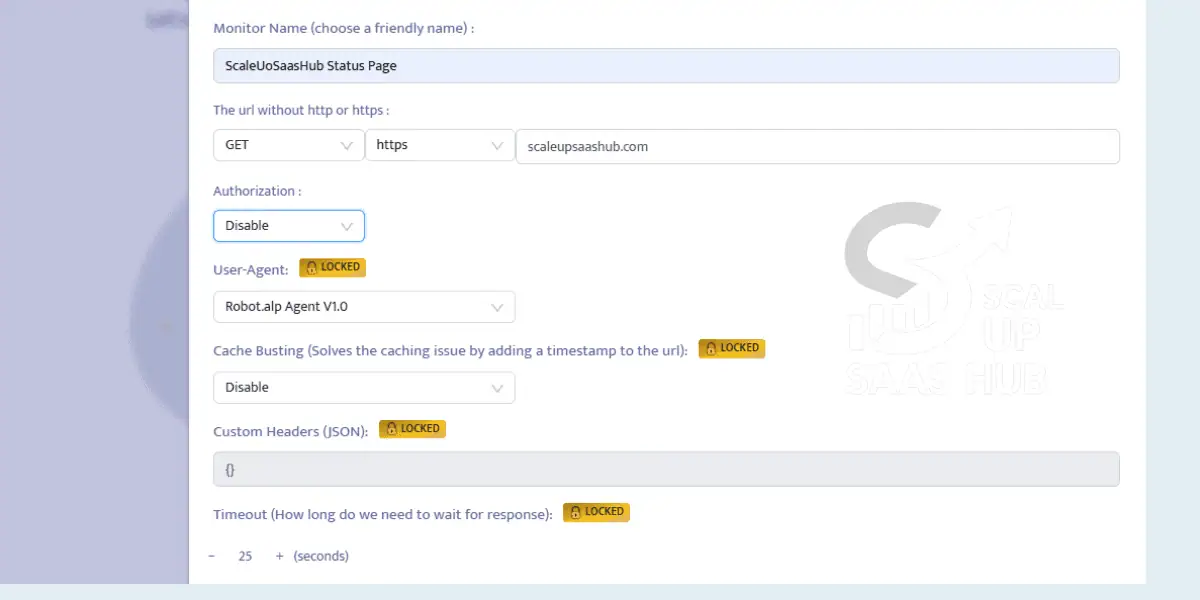
On this screen, you'll configure the monitor.
- Monitor Name: Give your monitor a friendly name that you'll easily recognize, like "My SaaS Homepage."
- The url: Enter the full URL of the website you want to monitor (e.g.,
httpsaashub.com). - Check interval (frequency): For the free plan, you can set this to as low as every 5 minutes. Select your desired frequency and click "Save."
Step 3: Confirming the Monitor Creation
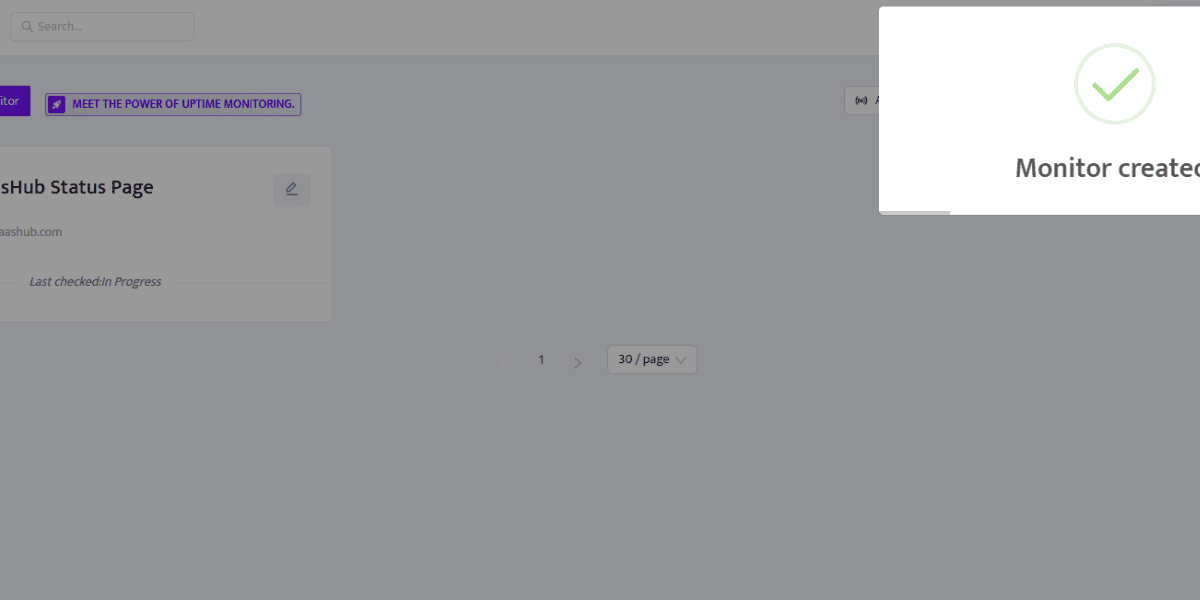
After saving, you'll be taken back to the Uptime Monitors list. A confirmation pop-up will appear saying "Monitor created." You will now see your new monitor in the list with an "In Progress" status as RobotAlp begins its initial checks.
Step 4: Check Your Email for Confirmation
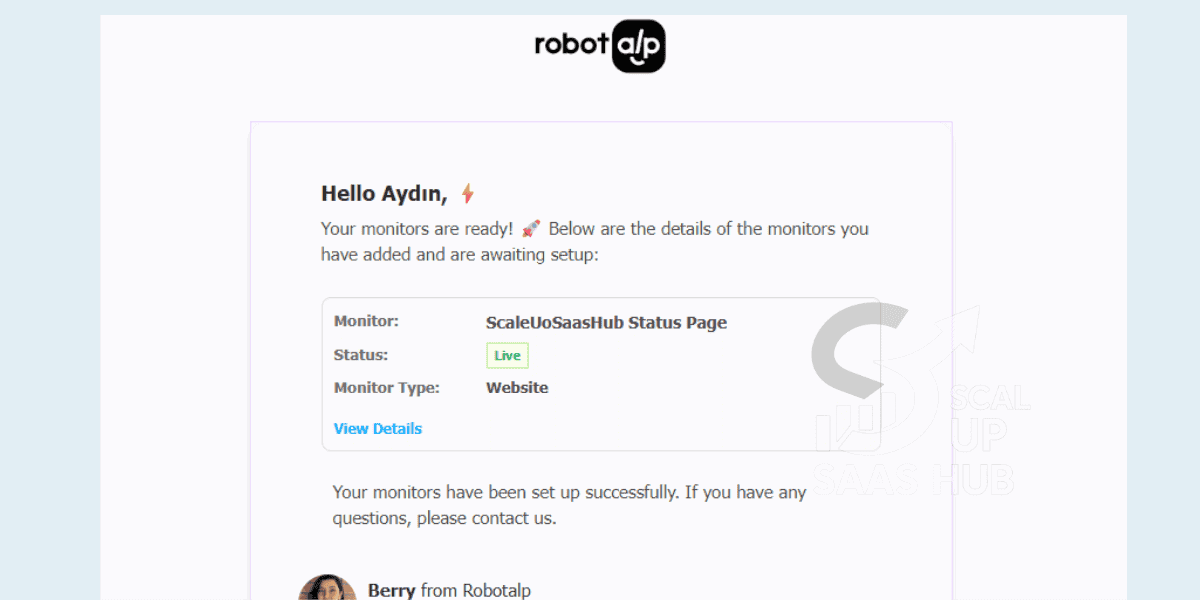
RobotAlp will send you a confirmation email to let you know that your monitor has been successfully set up and is awaiting its first checks. This email, from "Berry from Robotalp," confirms that the system is now actively watching your site.
Step 5: Viewing the Monitor Dashboard
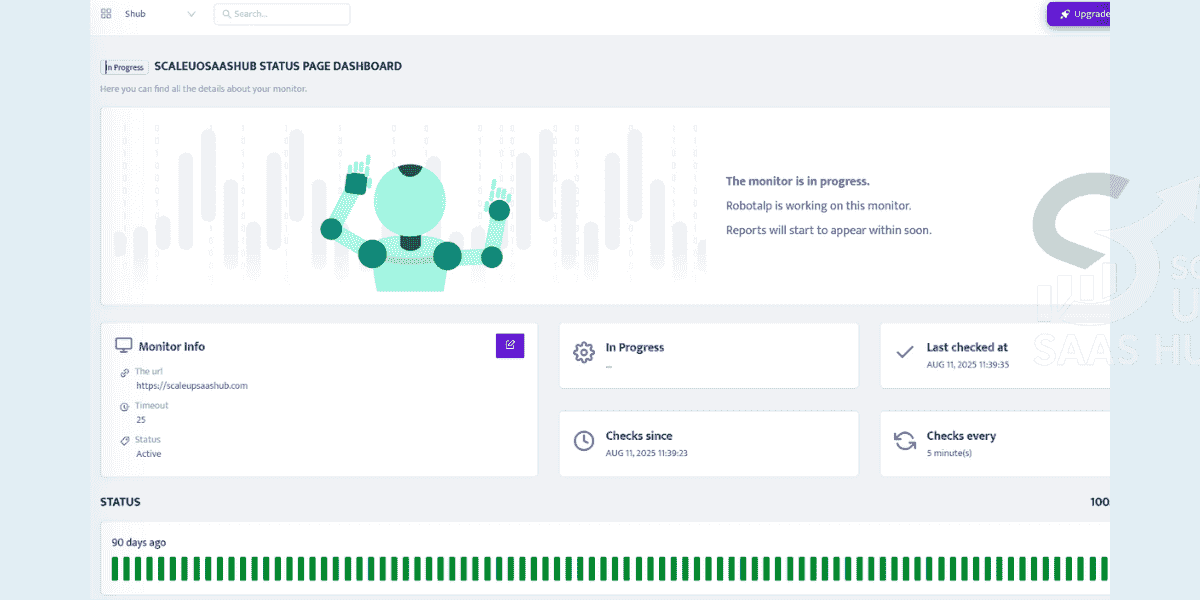
By clicking "View Details" in the email or on the monitor from your dashboard list, you can access its detailed view. Initially, you will see a message that "The monitor is in progress." Below, you can see the Monitor Info card with your URL and, most importantly, the STATUS bar, which will show your uptime history over the last 90 days.
Step 6: Analyzing Performance Data
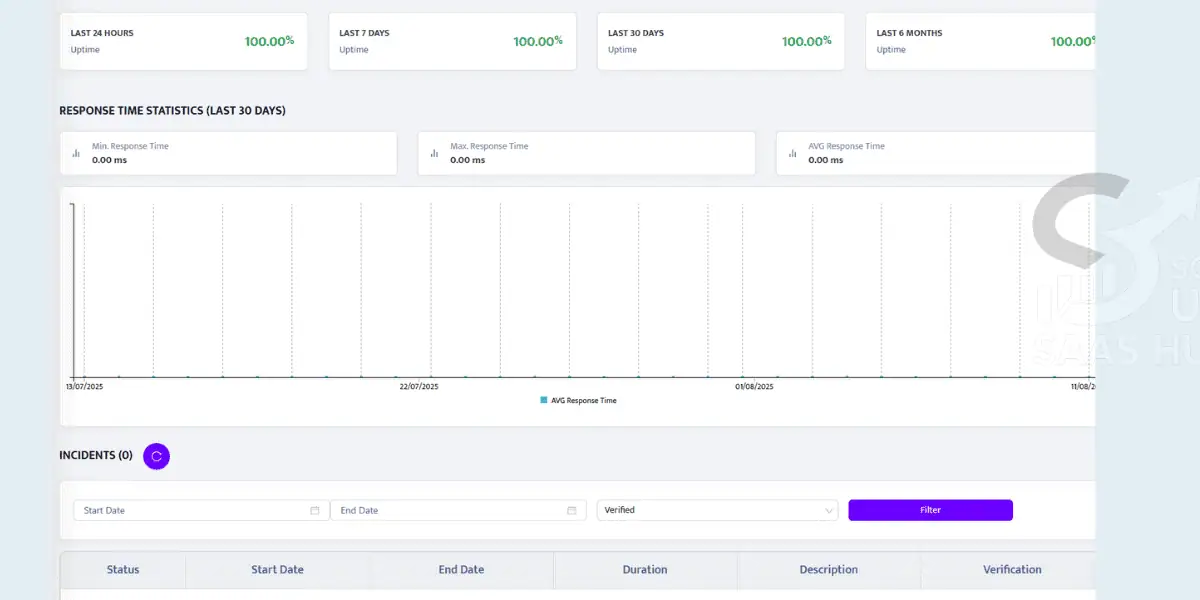
On the same details page, scrolling down reveals more in-depth data. You can see your website's Response Time Statistics over the last 30 days, which helps you understand its performance. The Incidents table at the bottom will log any downtime events, giving you a complete history of your site's availability.
Part 2: Creating and Configuring Your Status Page
Now that you have a monitor running, it's time to create a public status page to display its status to your users.
Step 7: Navigate to the Status Pages Section
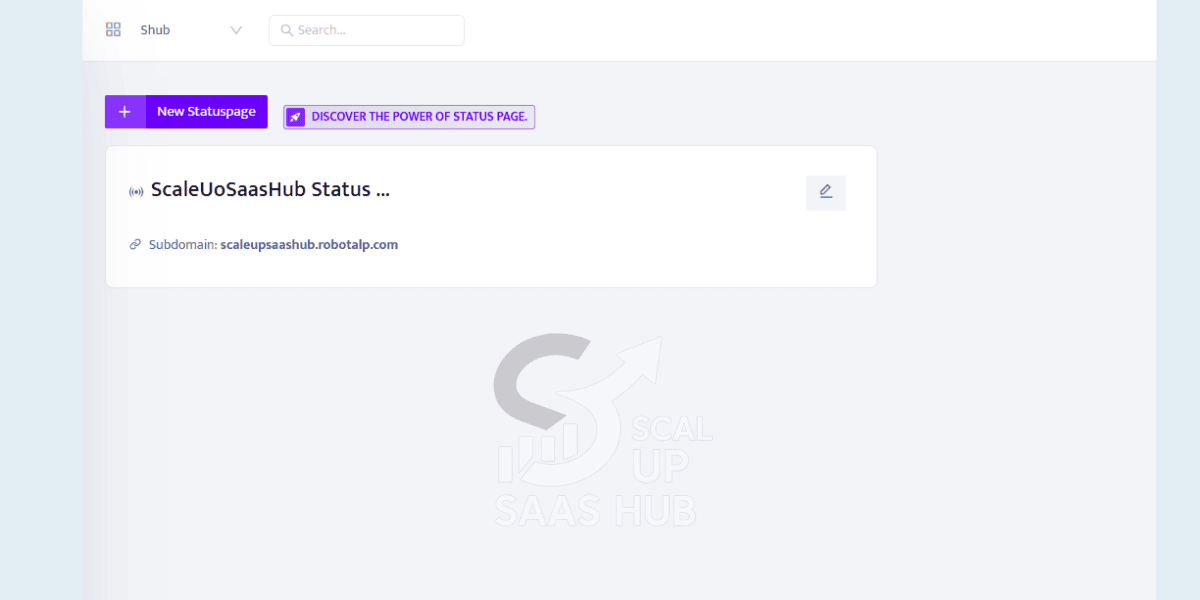
From the main menu on the left, click on "Status Pages." Here you will see a list of all the status pages you have created. To configure one, simply click the pencil (edit) icon next to its name.
Step 8: Configure Your Status Page Settings
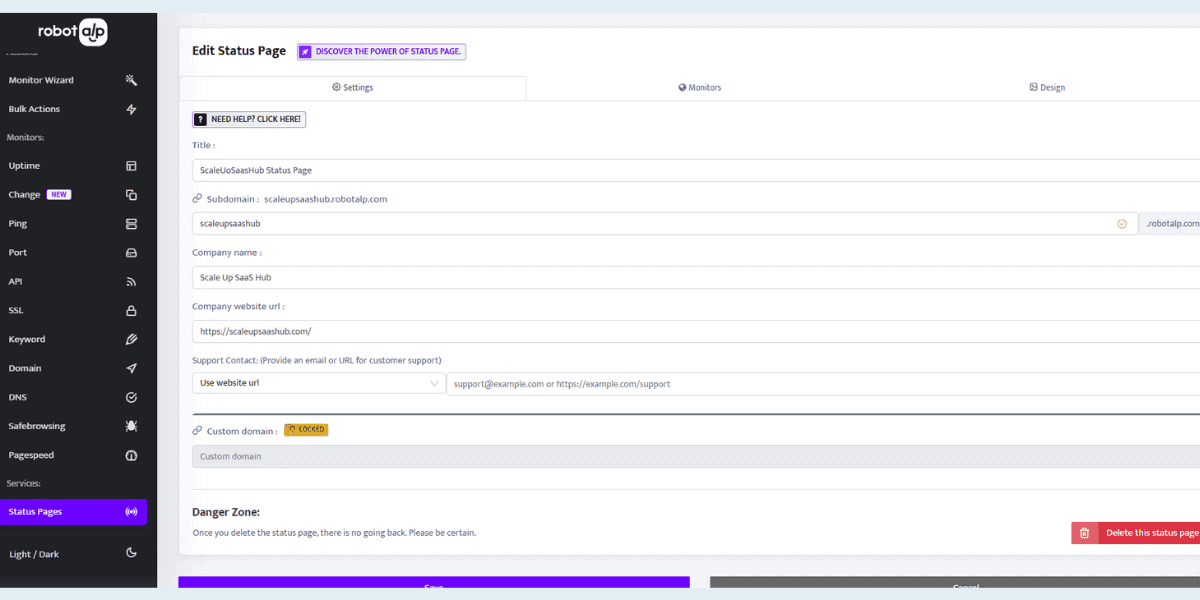
You will first land on the "Settings" tab. This is where you can customize the identity of your status page:
- Title: The public name of your status page.
- Subdomain: Choose a custom subdomain (e.g.,
scaleupsaasub.robotalp.com). - Company Name & Website: Add your company details for branding.
- Support Contact: Provide an email or URL for your users to contact support.
Step 9: Add Your Monitor to the Page
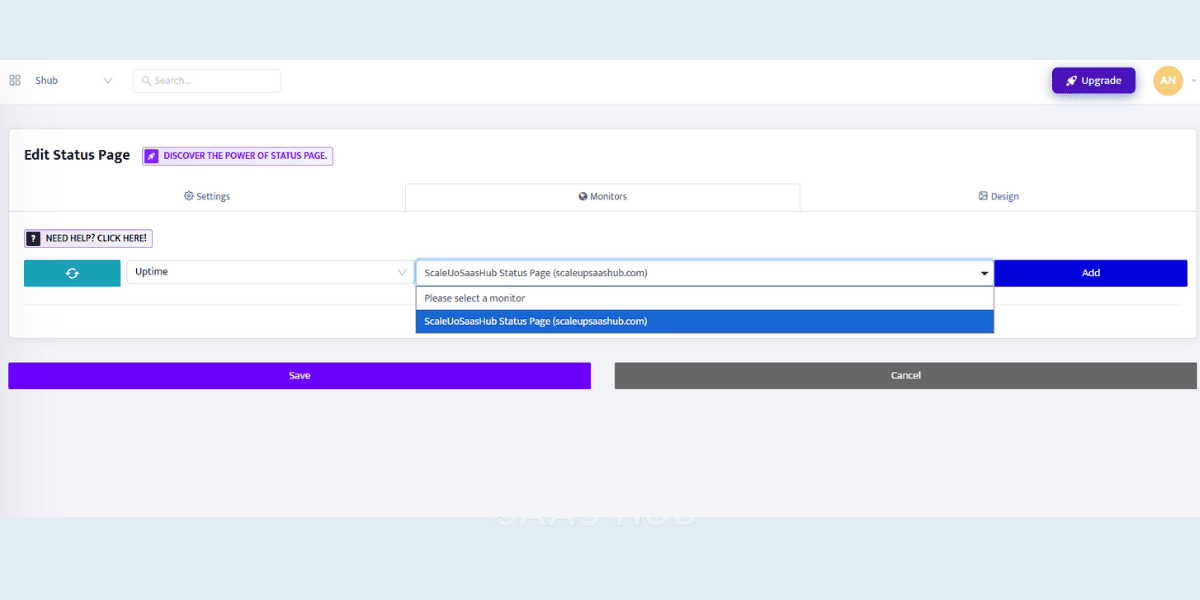
Next, click on the "Monitors" tab. Here, you will see a dropdown list of all the monitors you have created. Select the uptime monitor you made in Part 1 ("ScaleUoSaasHub Status Page") and click the blue "Add" button.
Step 10: Set a Public Name for the Monitor
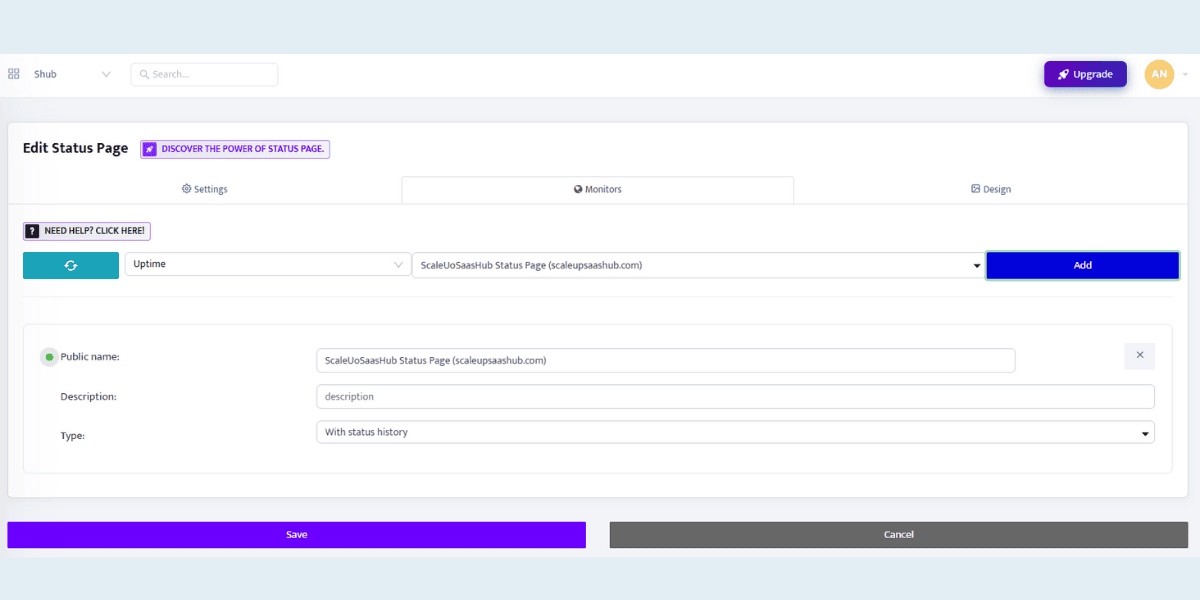
Once the monitor is added, it will appear in a list on the same page. Here you can give it a more user-friendly "Public name" that your visitors will see.
Step 11: Add a Description
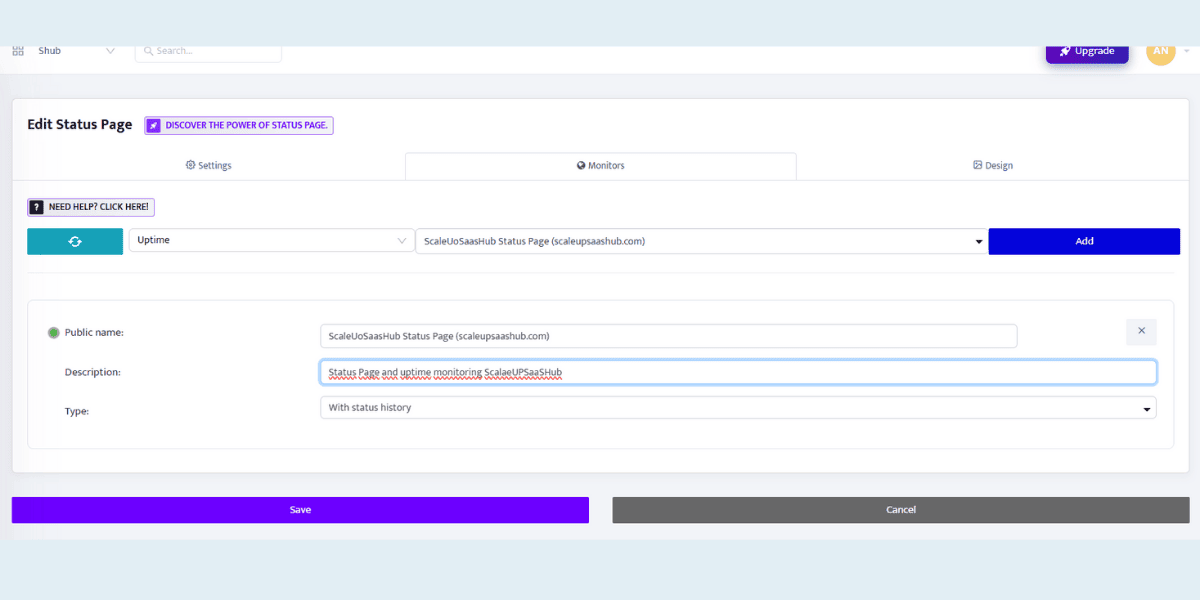
For more clarity, you can add a short "Description" for each monitor. This text will appear on the public status page and can help your users understand what service that specific monitor represents (e.g., "Main website and uptime monitoring"). After filling this in, click the purple "Save" button.
Step 12: View Your Live Status Page!
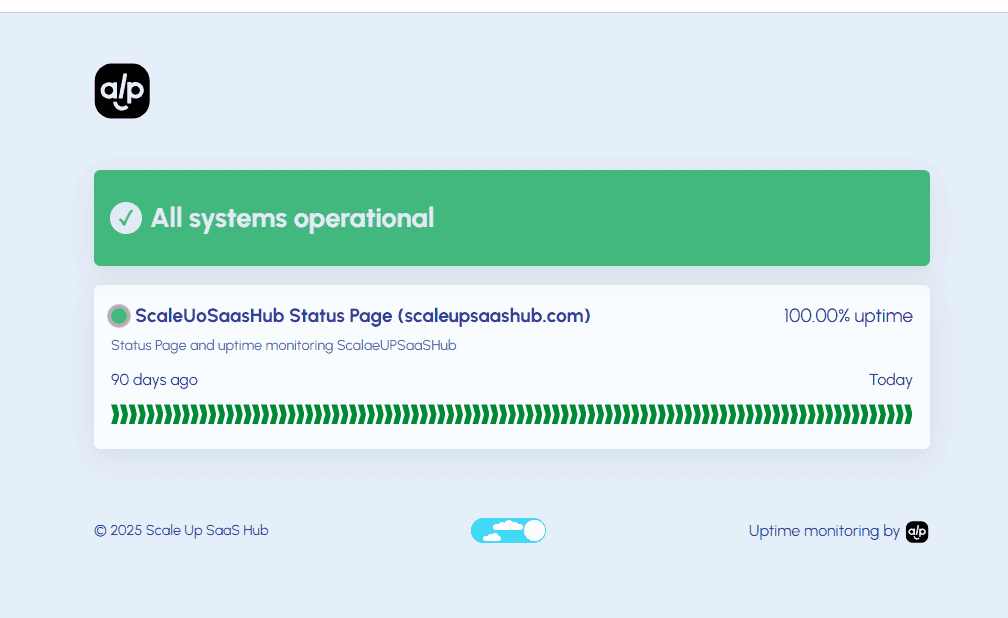
That's it! You can now visit your custom subdomain to see your live, public-facing status page. It will display the overall status (e.g., "All systems operational"), a list of your monitored services, and their 90-day uptime history, helping you build trust and communicate transparently with your users.